
Key Metrics Introduction:
User Acquisition:
Page Views & Unique Page Views:
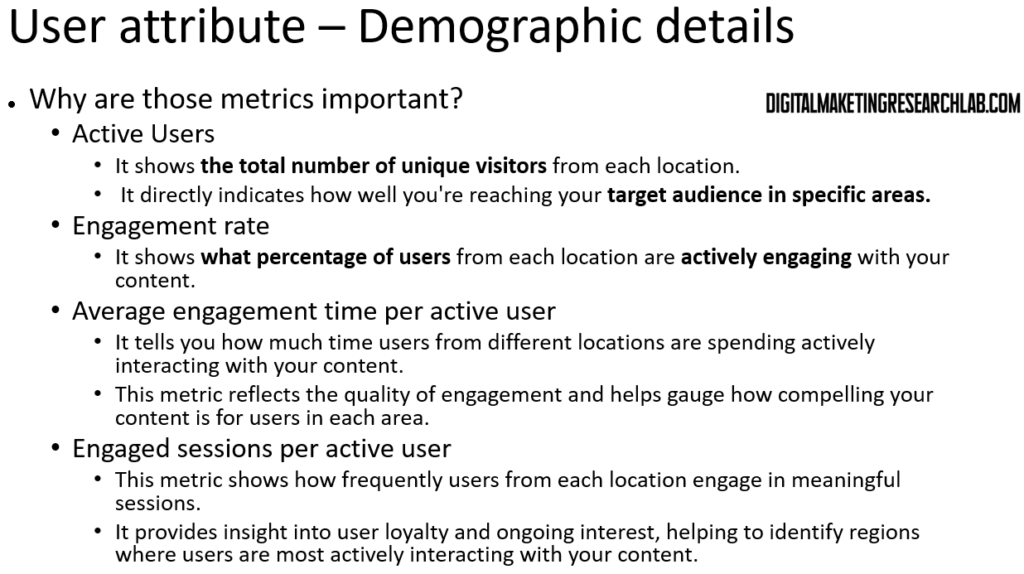
Demographic Details:
Explanation:
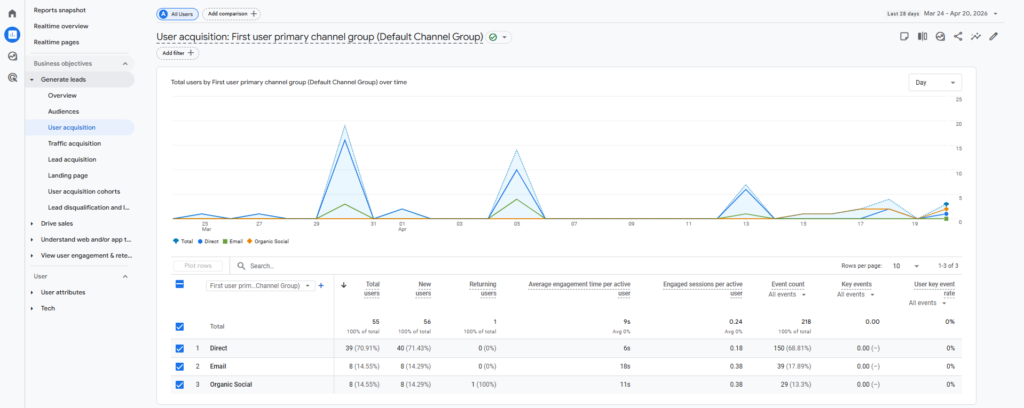
User acquisition: It shows how many new users visit the website through LinkedIn, email, and other sources. It’s particularly useful for evaluating the effectiveness of LinkedIn as a traffic source.
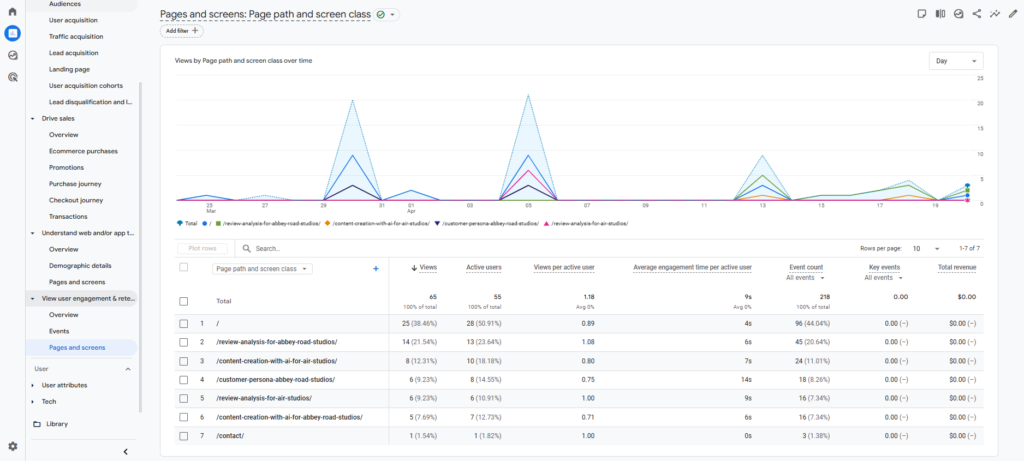
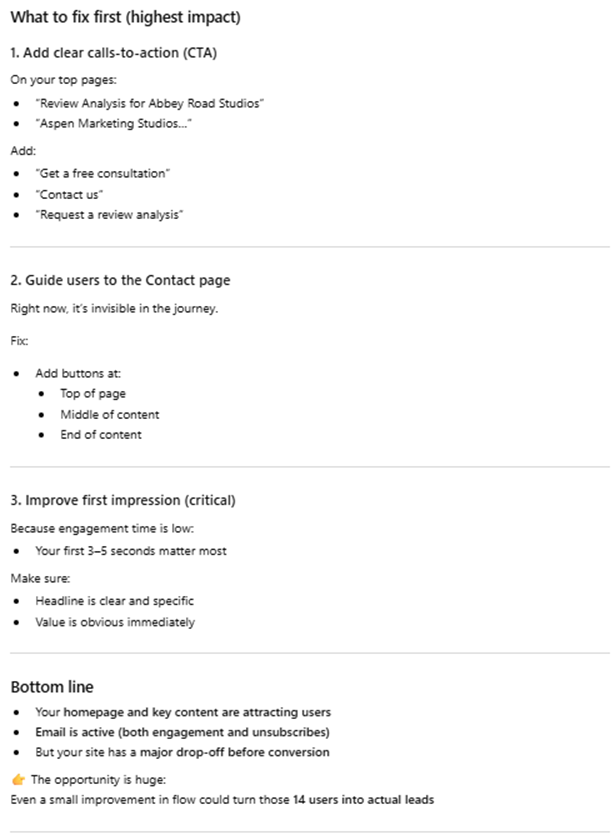
Page Views & Unique Page Views: This helps identify which blog posts are the most popular. So, you can determine which topics or content types are most appealing to employees of the target companies.
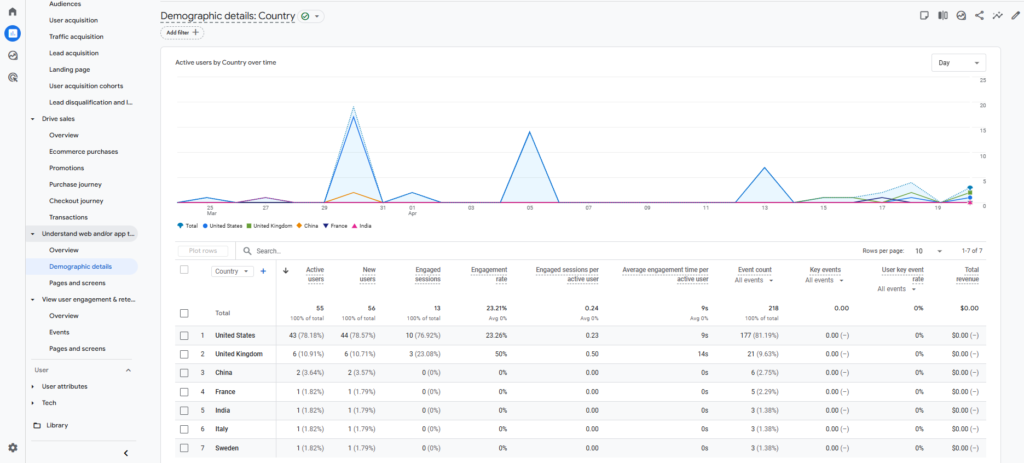
Demographic details: It aligns with the your goal of targeting specific companies in particular locations and helps measure the effectiveness of their efforts to attract attention from these target areas.
User Acquisition:
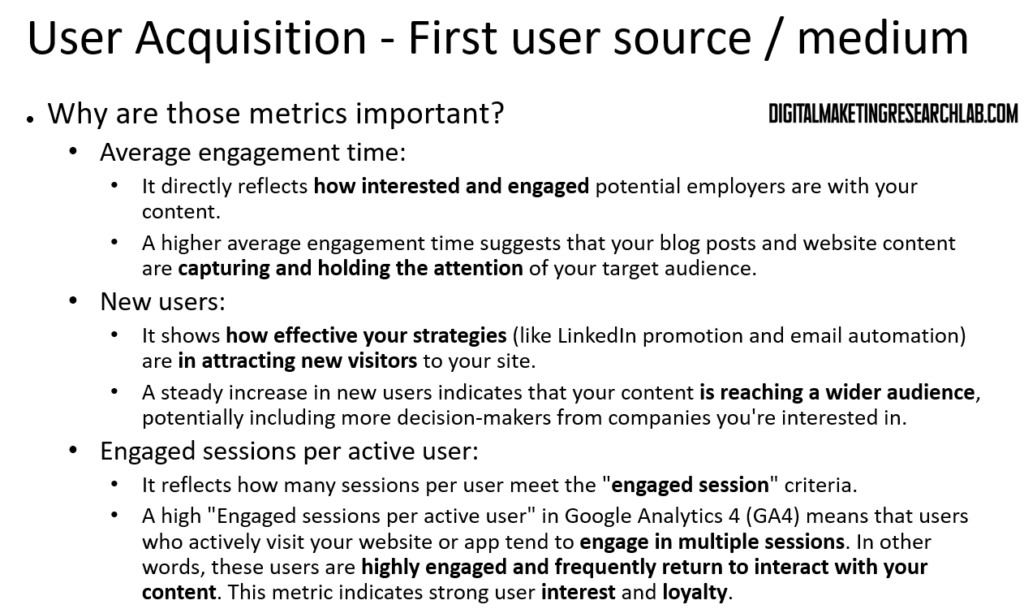
Average Engagement Time
Explanation: Why I used “First user source / medium” and why I used the following metrics: Average engagement time, New users, Engagement
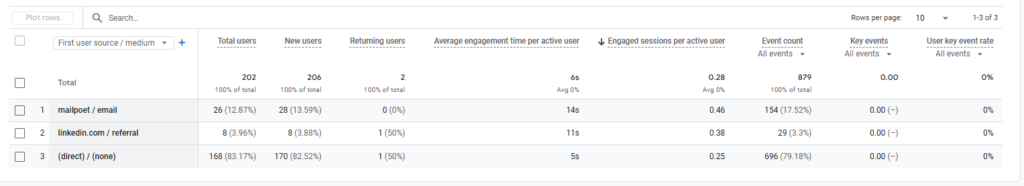
Result (First user source / medium):
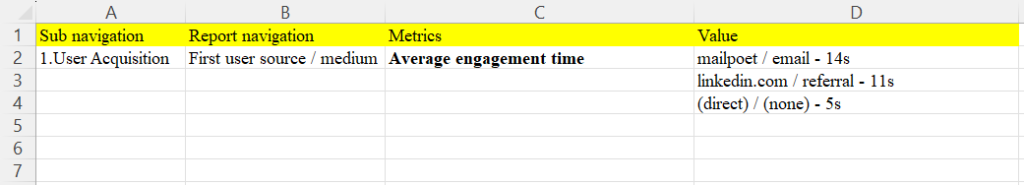
Excel Result:
Chat GPT Prompt:
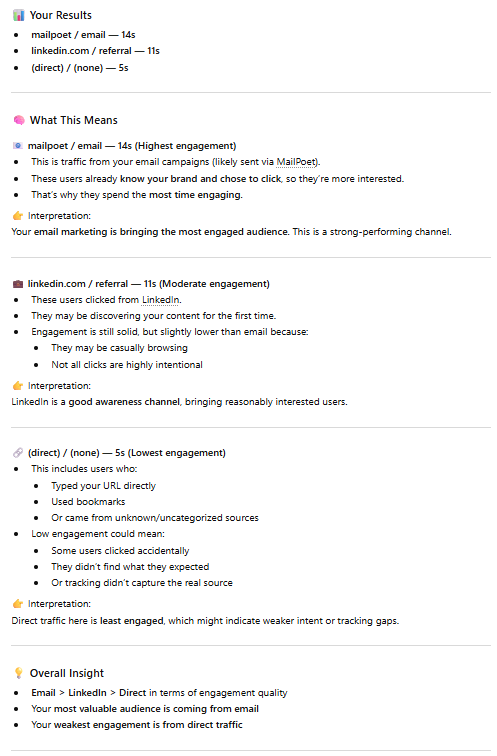
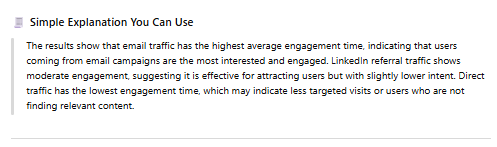
I entered this prompt into ChatGPT: When I sorted the average engagement time in descending order in the First user source/medium classification, the following result came out. Please explain mailpoet / email – 14s linkedin.com / referral – 11s (direct) / (none) – 5s
Result:
New Users
Result (First user source / medium):
Excel Result:
Chat GPT Prompt:
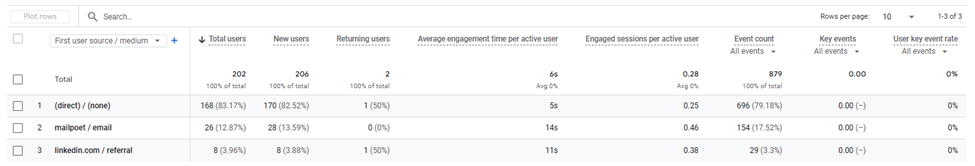
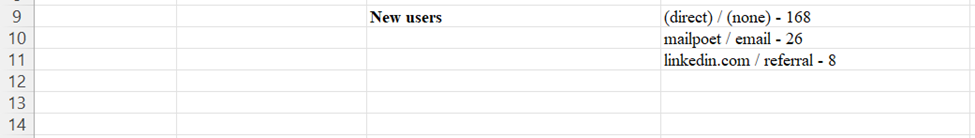
I entered this prompt into ChatGPT: When I sorted new users in descending order in the First user source/medium classification, the following result came out. Please explain (direct) / (none) – 168 mailpoet / email – 26 linkedin.com / referral – 8
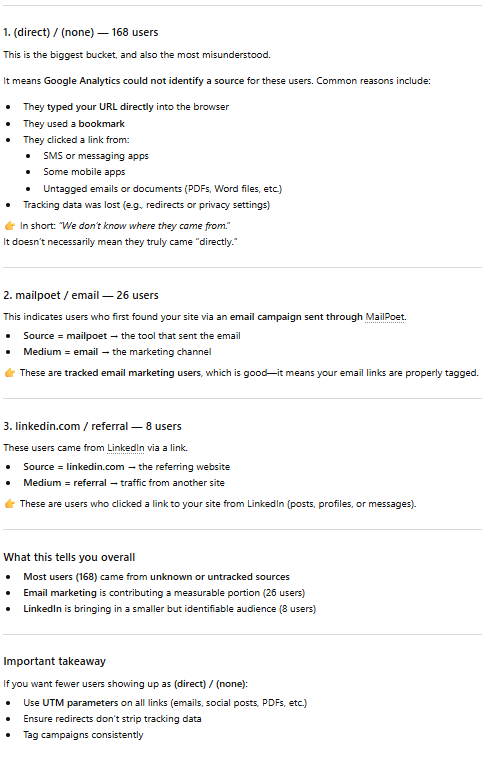
Result:
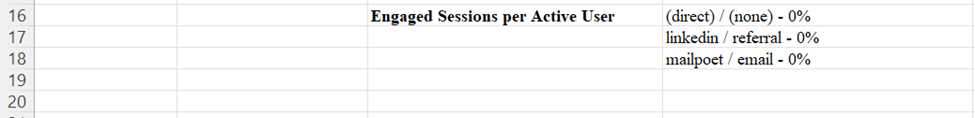
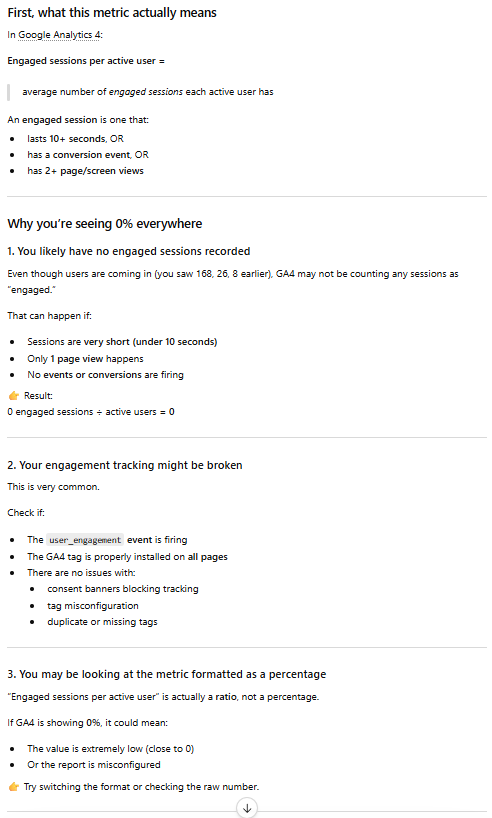
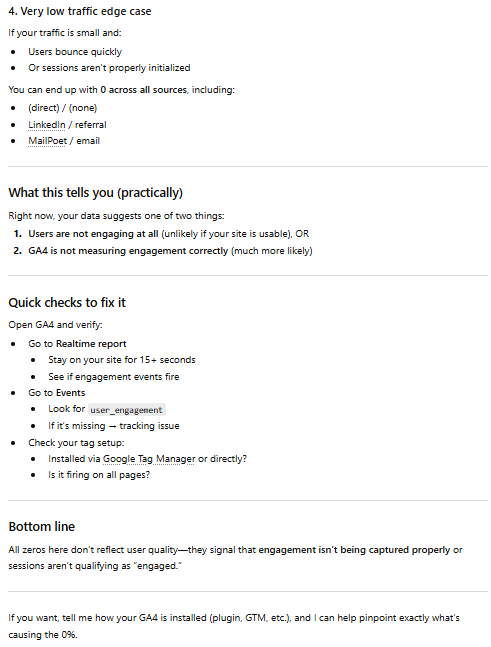
Engagement
Result (First user source / medium):
Excel Result:
Chat GPT Prompt:
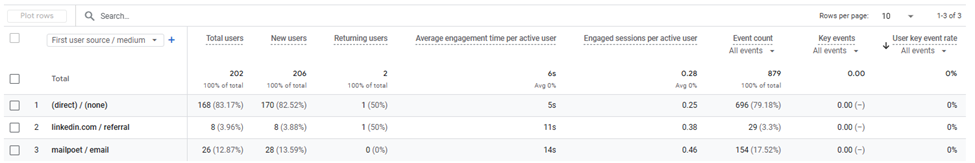
I entered this prompt into ChatGPT: When I sorted the engaged session per active user in descending order in the First user source/medium classification, the following result came out. Please explain (direct) / (none) – 0% linkedin / referral – 0% mailpoet / email – 0%
Result:
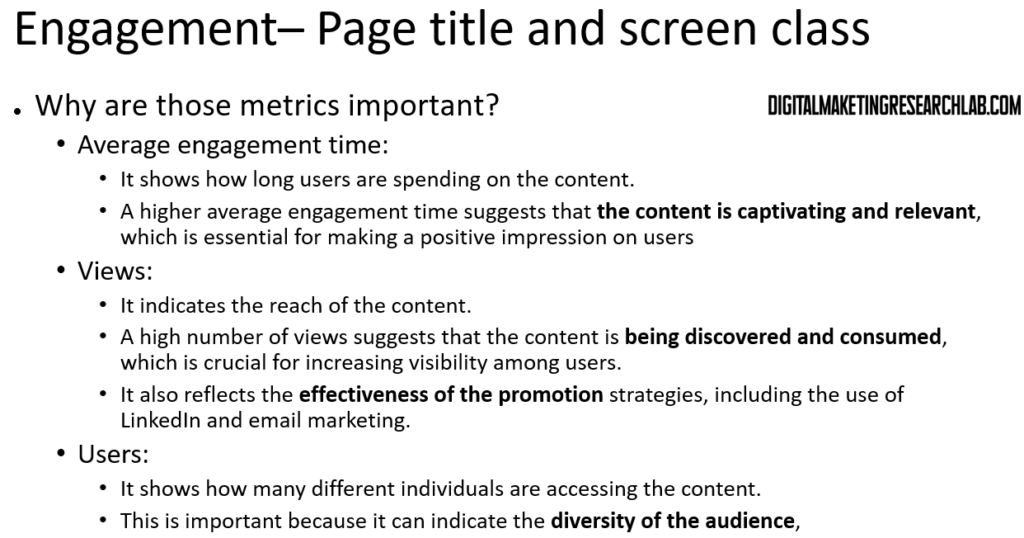
Engagement:
Explanation: Why I used “Page title and screens” and why I used the following metrics: Average engagement time, views, Users
Average Engagement Time
Result (Page title and screens):
Excel Result:
ChatGPT Prompt:
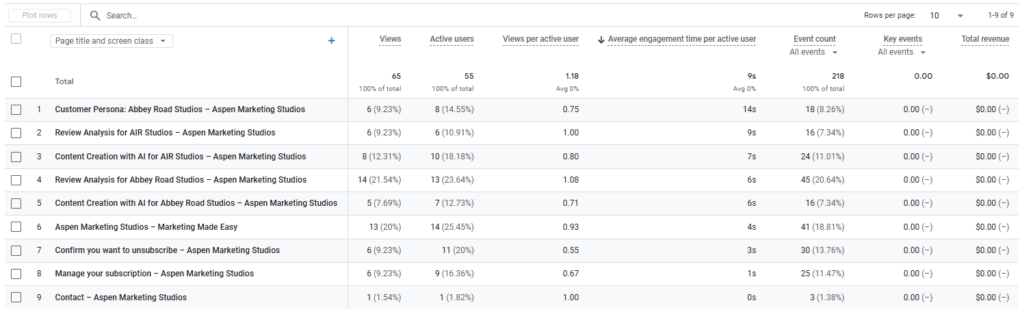
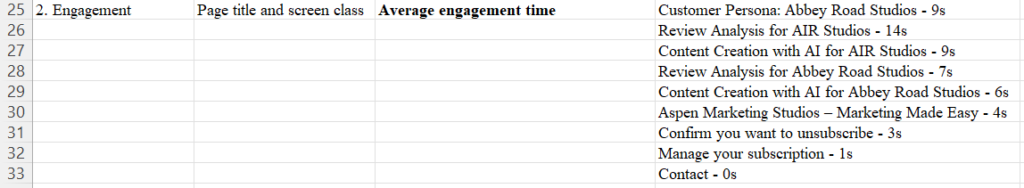
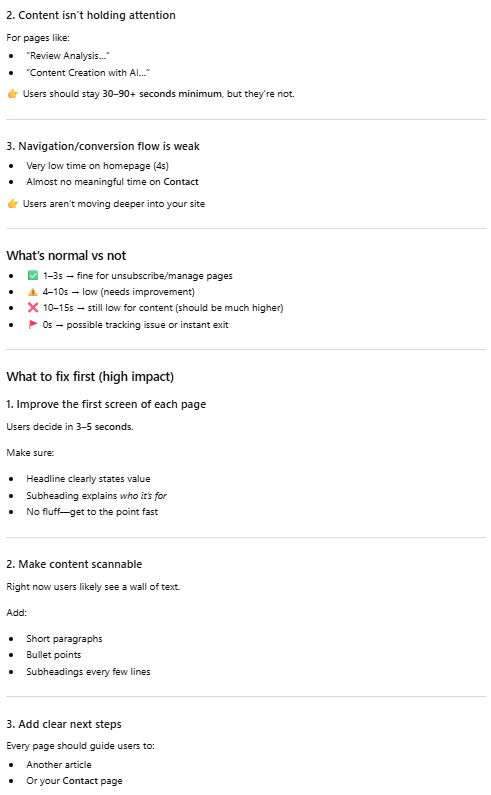
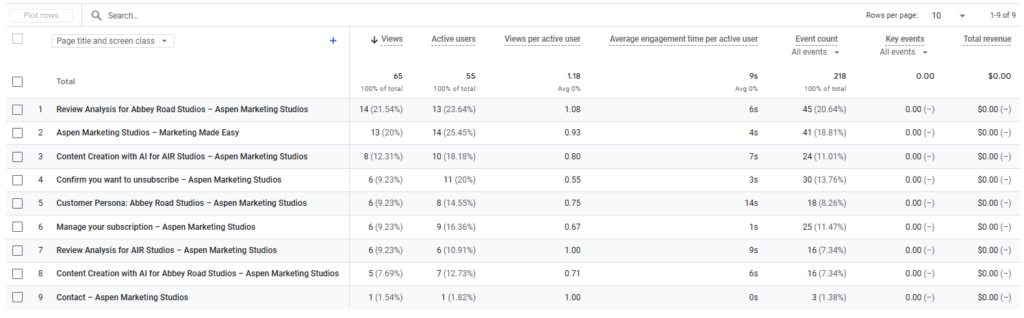
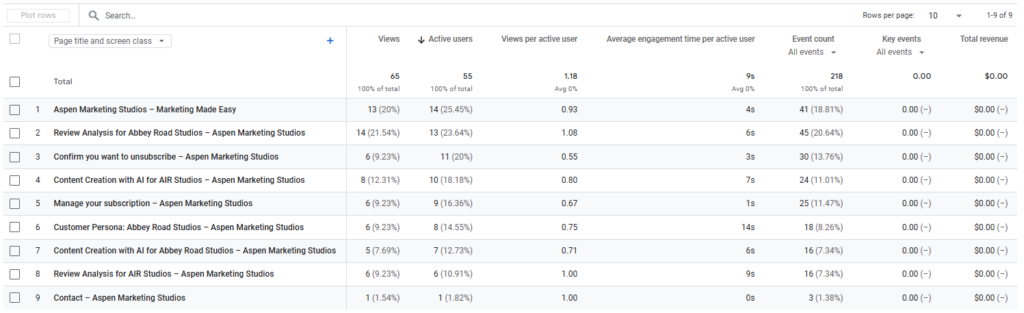
I entered this prompt into ChatGPT: When I sorted the average engagement time in descending order in the Page title and screens classification, the following result came out. Please explain Customer Persona: Abbey Road Studios – 9s / Review Analysis for AIR Studios – 14s / Content Creation with AI for AIR Studios – 9s / Review Analysis for Abbey Road Studios – 7s / Content Creation with AI for Abbey Road Studios – 6s / Aspen Marketing Studios – Marketing Made Easy – 4s / Confirm you want to unsubscribe – 3s / Manage your subscription – 1s / Contact – 0s
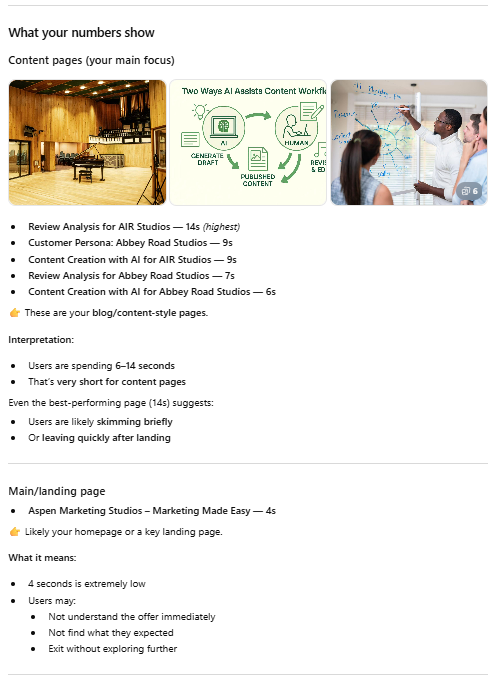
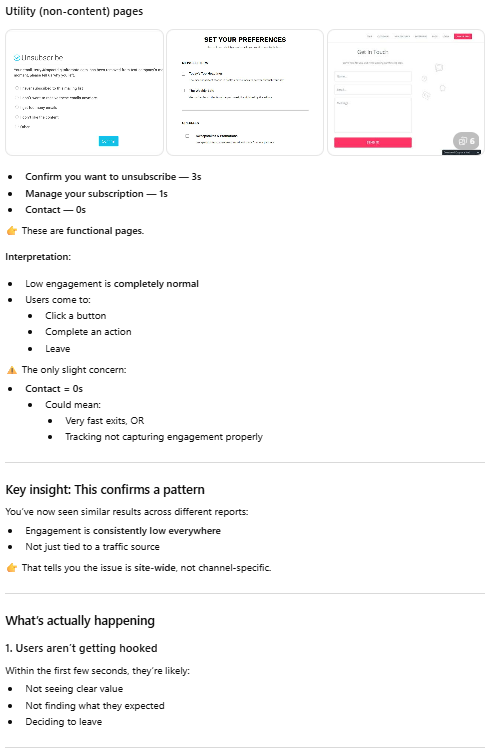
Result:
Views
Result (Page title and screens):
Excel Result:
ChatGPT Prompt:
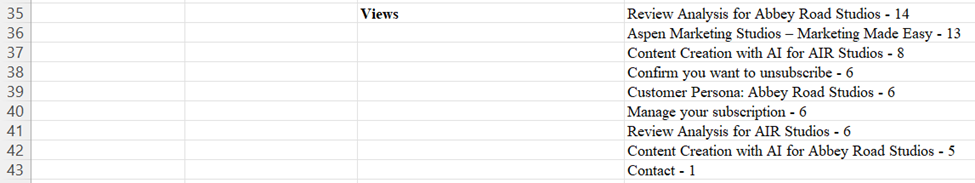
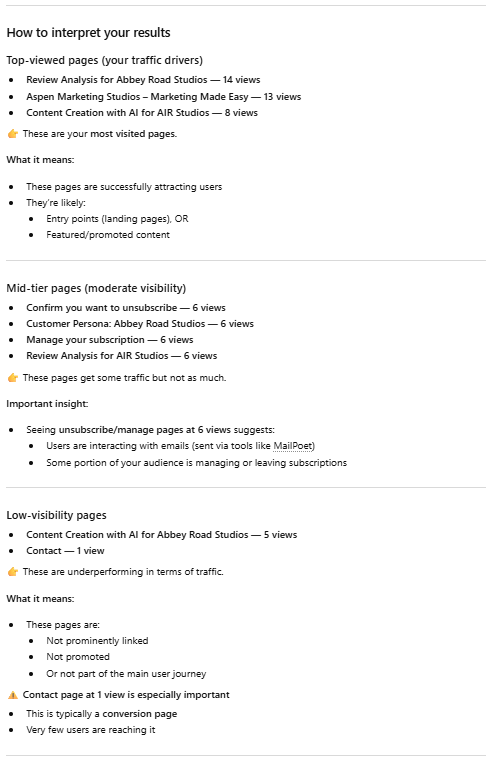
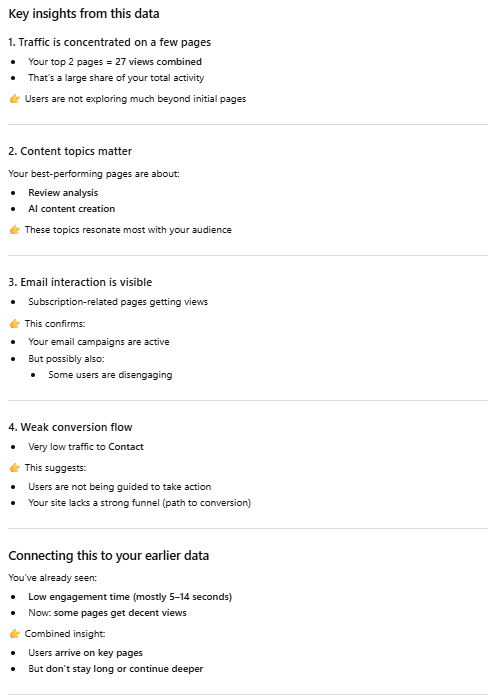
I entered this prompt into ChatGPT: When I sorted the view count in descending order in the Page title and screens classification, the following result came out. Please explain Review Analysis for Abbey Road Studios – 14 / Aspen Marketing Studios – Marketing Made Easy – 13 / Content Creation with AI for AIR Studios – 8 / Confirm you want to unsubscribe – 6 / Customer Persona: Abbey Road Studios – 6 / Manage your subscription – 6 / Review Analysis for AIR Studios – 6 / Content Creation with AI for Abbey Road Studios – 5 / Contact – 1
Result:
Users
Result (Page title and screens):
Excel Result:
ChatGPT Prompt:
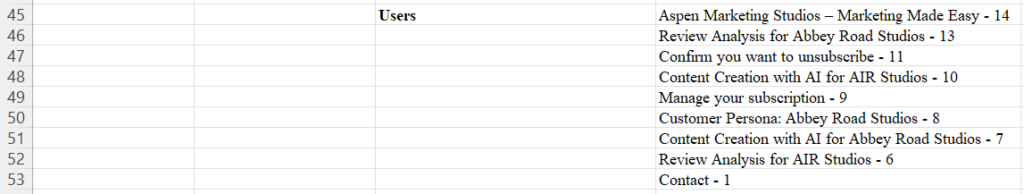
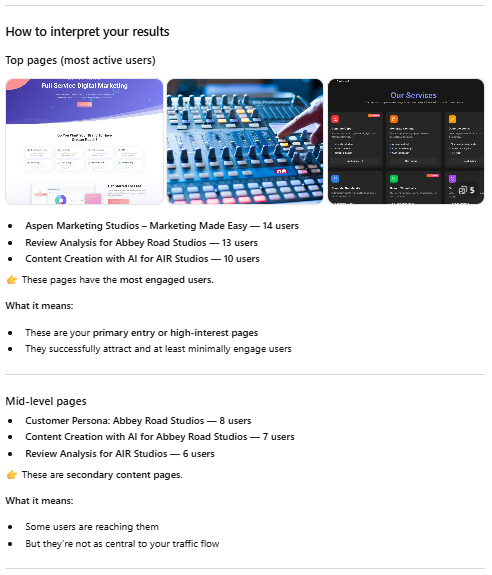
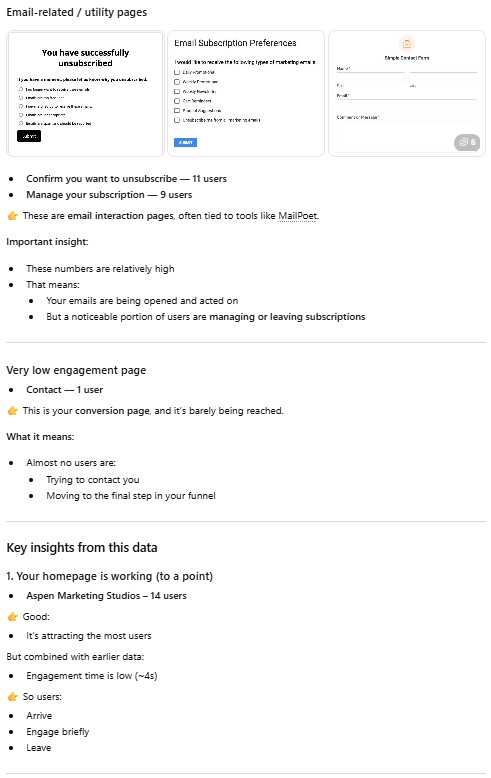
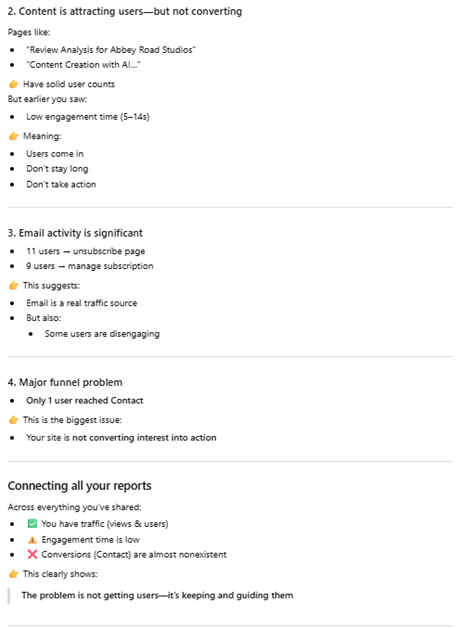
I entered this prompt into ChatGPT: When I sorted the active users in descending order in the Page title and screens classification, the following result came out. Please explain Aspen Marketing Studios – Marketing Made Easy – 14 / Review Analysis for Abbey Road Studios – 13 / Confirm you want to unsubscribe – 11 / Content Creation with AI for AIR Studios – 10 / Manage your subscription – 9 / Customer Persona: Abbey Road Studios – 8 / Content Creation with AI for Abbey Road Studios – 7 / Review Analysis for AIR Studios – 6 / Contact – 1
Result:
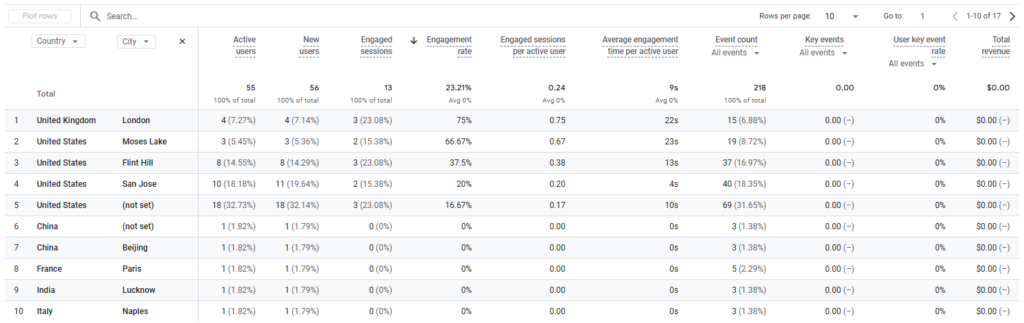
Demographic Details
Explanation: Why I used “Country and City” and why I used the following metrics: Users, Engagement rate, Average engagement time, Engaged session per user.
Users
Result (Page title and screens):
Excel Result:
ChatGPT Prompt:
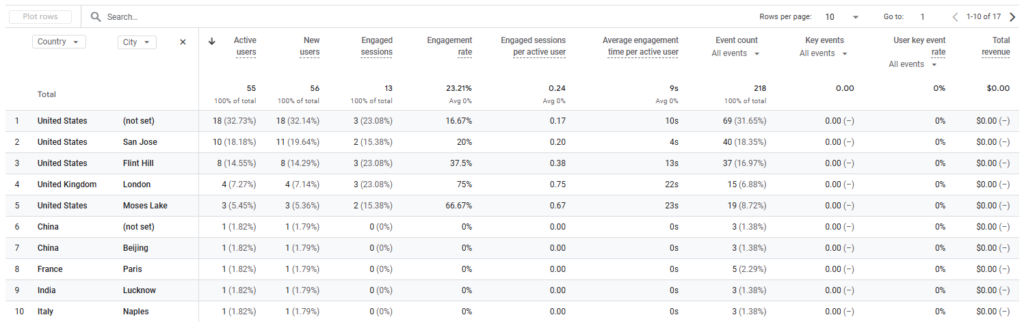
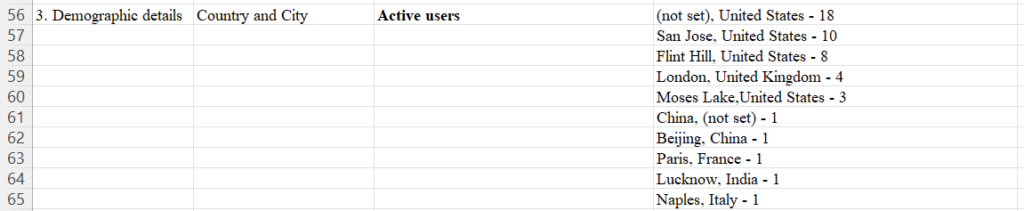
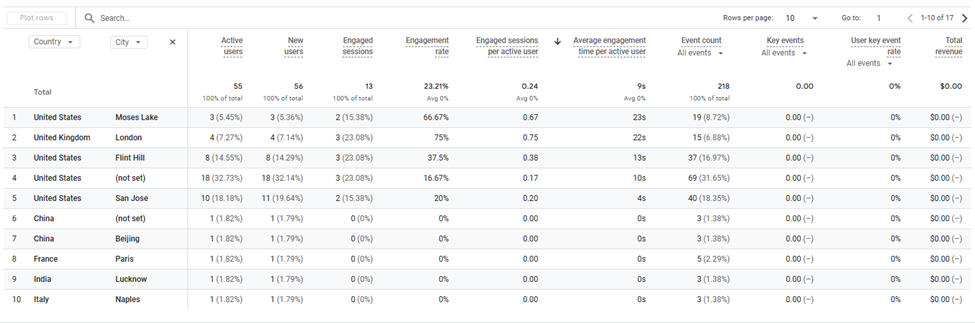
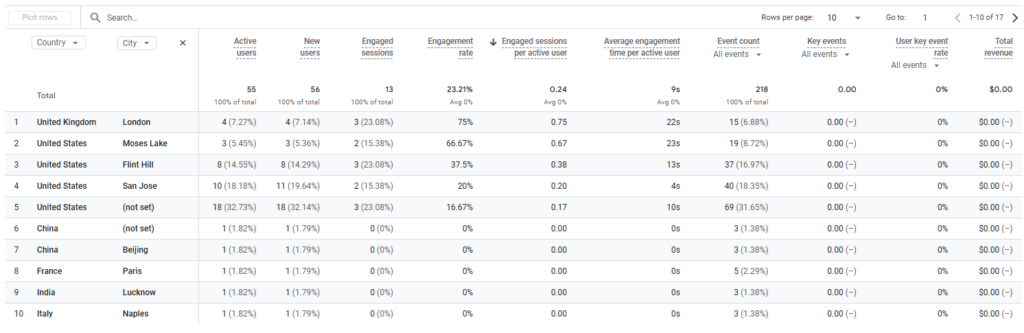
I entered this prompt into ChatGPT: When I sorted the active users in descending order in the Country and City classification, the following result came out. Please explain (not set), United States – 18 / San Jose, United States – 10 / Flint Hill, United States – 8 / London, United Kingdom – 4 / Moses Lake, ,United States – 3 / China, (not set) – 1 / Beijing, China – 1 / Paris, France – 1 / Lucknow, India – 1 / Naples, Italy – 1
Result:
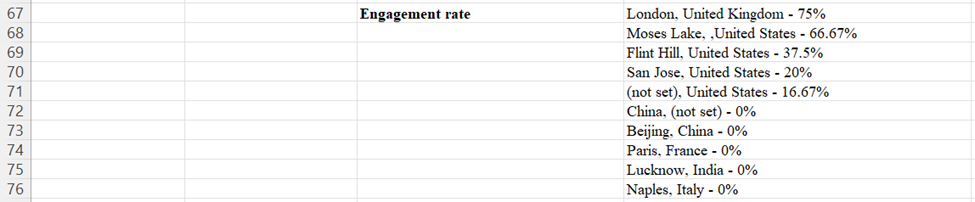
Engagement Rate
Result (Page title and screens):
Excel Result:
ChatGPT Prompt:
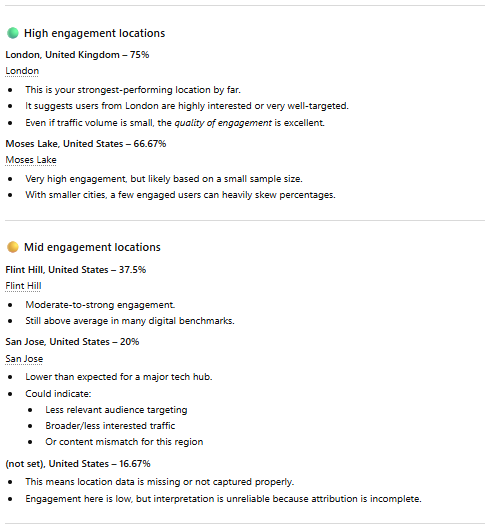
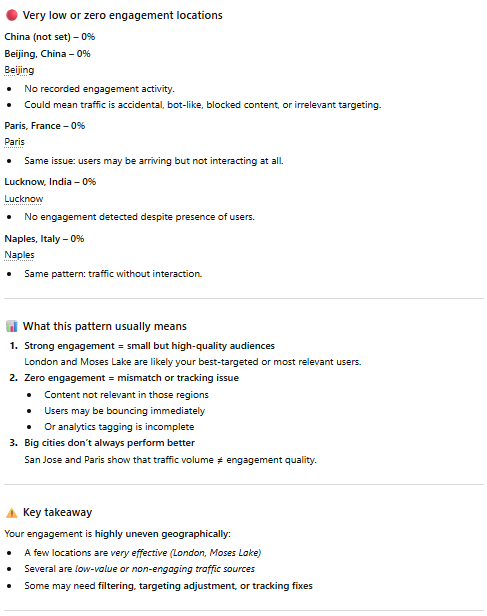
I entered this prompt into ChatGPT: When I sorted the engagement rate in descending order in the Country and City classification, the following result came out. Please explain London, United Kingdom – 75% / Moses Lake, ,United States – 66.67% / Flint Hill, United States – 37.5% / San Jose, United States – 20% / (not set), United States – 16.67% / China, (not set) – 0% / Beijing, China – 0% / Paris, France – 0% / Lucknow, India – 0% / Naples, Italy – 0%
Result:
Average Engagement Time
Result (Page title and screens):
Excel Result:
ChatGPT Prompt:
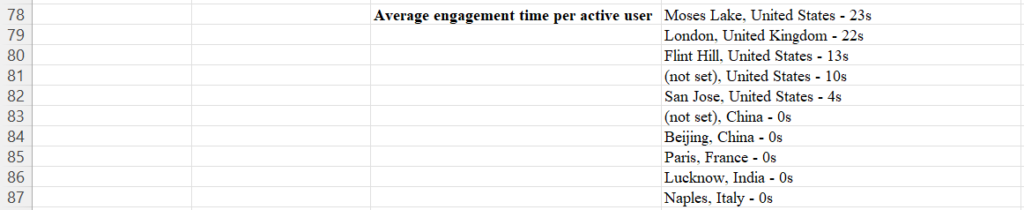
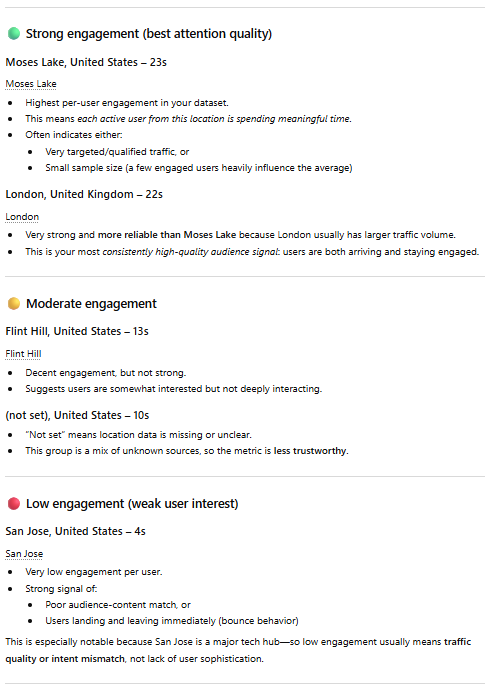
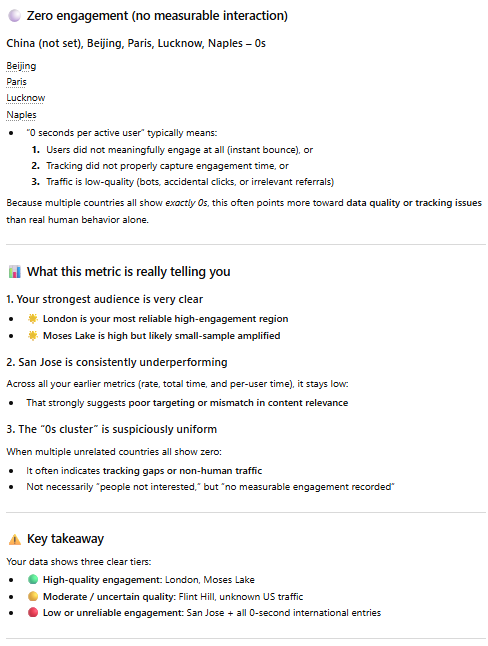
I entered this prompt into ChatGPT: When I sorted the engagement rate in descending order in the Country and City classification, the following result came out. Please explain Moses Lake, United States – 23s / London, United Kingdom – 22s / Flint Hill, United States – 13s / (not set), United States – 10s / San Jose, United States – 4s / (not set), China – 0s / Beijing, China – 0s / Paris, France – 0s / Lucknow, India – 0s / Naples, Italy – 0s
Result:
Engaged Session Per User
Result (Page title and screens):
Excel Result:
ChatGPT Prompt:
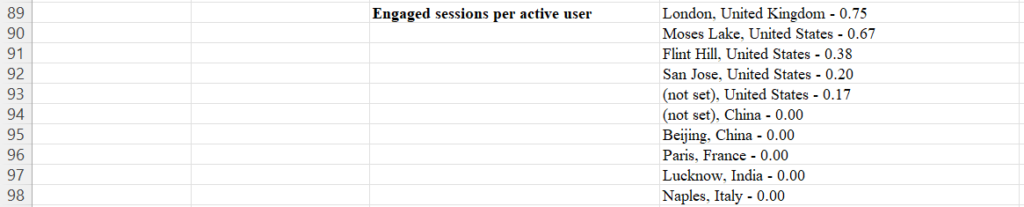
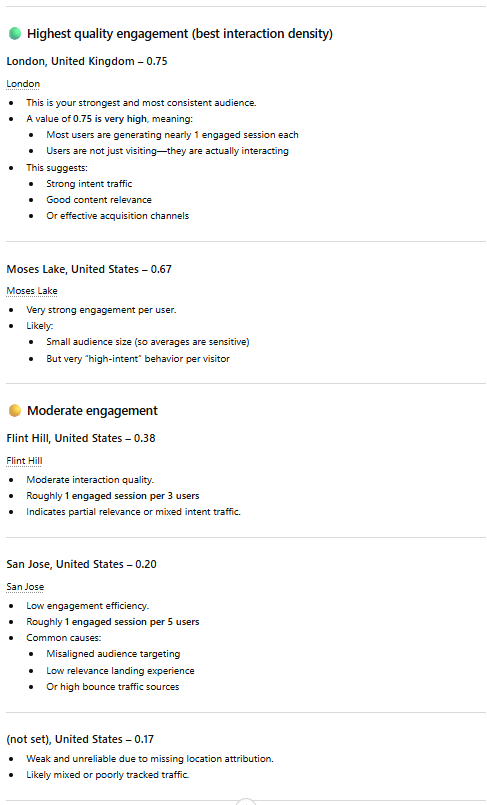
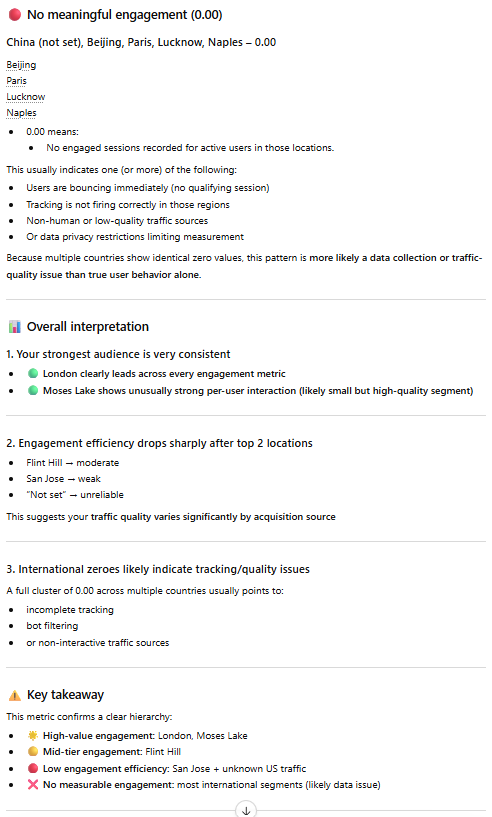
I entered this prompt into ChatGPT: When I sorted the engaged sessions per active user in descending order in the Country and City classification, the following result came out. Please explain London, United Kingdom – 0.75 / Moses Lake, United States – 0.67 / Flint Hill, United States – 0.38 / San Jose, United States – 0.20 / (not set), United States – 0.17 / (not set), China – 0.00 / Beijing, China – 0.00 / Paris, France – 0.00 / Lucknow, India – 0.00 / Naples, Italy – 0.00
Result:
Conclusion
This comprehensive guide provides a structured approach to analyzing your digital marketing efforts using Google Analytics 4 (GA4). By focusing on key metrics such as user acquisition, page views, demographic details, and engagement rates, you can gain valuable insights into the effectiveness of your strategies. The step-by-step instructions for data collection and analysis, combined with the use of ChatGPT for interpretation, offer a powerful method to understand your website’s performance and its impact on potential employers.
This approach allows you to identify which content resonates most with your target audience, which traffic sources are most effective, and how well you’re reaching your desired geographic locations. By regularly reviewing these metrics and adjusting your strategies accordingly, you can continually improve your digital presence and increase your appeal to potential employers in your chosen field. Remember to always consider the context of your data and be prepared to intervene in the analysis when necessary, as you possess knowledge about your specific situation that AI tools may not have.

Image Source: Leonardo.AI